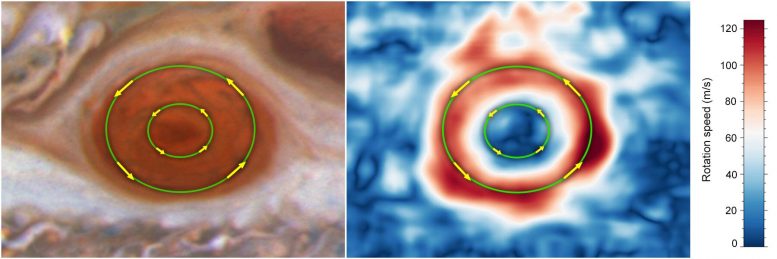
Lead image: By analyzing images taken by the NASA/ESA Hubble Space Telescope between 2009 and 2020, researchers found that the average wind speed just within the boundaries of the Great Red Spot, set off by the outer green circle, have increased by up to 8 percent and exceed 640 kilometers per hour. In contrast, the winds near the storm’s innermost region, set off by a smaller green ring, are moving significantly more slowly. Both move counterclockwise. Credit: NASA, ESA, Michael H. Wong (UC Berkeley)
The Winds at the Outer Edge Are ‘Winning the Race’ in This Enormous Storm System
Listen up, race fans! The innermost lane no longer has a predictable advantage. In Jupiter’s Great Red Spot, a storm that has been roiling for centuries, the speed in its “outer lane” is moving faster than the inner lane – and continues to pick up speed. By analyzing long-term data in this high-speed ring, researchers found the winds have increased by up to 8 percent from 2009 to 2020. These findings could only be made with Hubble: The telescope has amassed more than 10 years of regular observations, acting like a “storm watcher” for the planets in our solar system.
Like the speed of an advancing race car driver, the winds in the outermost “lane” of Jupiter’s Great Red Spot are accelerating – a discovery only made possible by NASA’s Hubble Space Telescope, which has monitored the planet for more than a decade.
Researchers analyzing Hubble’s regular “storm reports” found that the average wind speed just within the boundaries of the storm, known as a high-speed ring, has increased by up to 8 percent from 2009 to 2020. In contrast, the winds near the red spot’s innermost region are moving significantly more slowly, like someone cruising lazily on a sunny Sunday afternoon.
The massive storm’s crimson-colored clouds spin counterclockwise at speeds that exceed 400 miles per hour – and the vortex is bigger than Earth itself. The red spot is legendary in part because humans have observed it for more than 150 years.
“When I initially saw the results, I asked ‘Does this make sense?’ No one has ever seen this before,” said Michael Wong of the University of California, Berkeley, who led the analysis published in Geophysical Research Letters. “But this is something only Hubble can do. Hubble’s longevity and ongoing observations make this revelation possible.”
We use Earth-orbiting satellites and airplanes to track major storms on Earth closely in real time. “Since we don’t have a storm chaser plane at Jupiter, we can’t continuously measure the winds on site,” explained Amy Simon of NASA’s Goddard Space Flight Center in Greenbelt, Maryland, who contributed to the research. “Hubble is the only telescope that has the kind of temporal coverage and spatial resolution that can capture Jupiter’s winds in this detail.”
The change in wind speeds they have measured with Hubble amount to less than 1.6 miles per hour per Earth year. “We’re talking about such a small change that if you didn’t have eleven years of Hubble data, we wouldn’t know it happened,” said Simon. “With Hubble we have the precision we need to spot a trend.” Hubble’s ongoing monitoring allows researchers to revisit and analyze its data very precisely as they keep adding to it. The smallest features Hubble can reveal in the storm are a mere 105 miles across, about twice the length of the state of Rhode Island.
Each loop in this video represents approximately 10 Earth hours or one Jupiter day, approximating what it would look like if the Great Red Spot were constantly illuminated. By analyzing this set of data from the NASA/ESA Hubble Space Telescope, researchers were able to simulate what the wind flow looks like around Jupiter’s Great Red Spot: just south of the Great Red Spot is an eastward jet and at the southern border is a westward jet. Credit: NASA, ESA, M. H. Wong (UC Berkeley)
“We find that the average wind speed in the Great Red Spot has been slightly increasing over the past decade,” Wong added. “We have one example where our analysis of the two-dimensional wind map found abrupt changes in 2017 when there was a major convective storm nearby.”
To better analyze Hubble’s bounty of data, Wong took a new approach to his data analysis. He used software to track tens to hundreds of thousands of wind vectors (directions and speeds) each time Jupiter was observed by Hubble. “It gave me a much more consistent set of velocity measurements,” Wong explained. “I also ran a battery of statistical tests to confirm if it was justified to call this an increase in wind speed. It is.”
What does the increase in speed mean? “That’s hard to diagnose, since Hubble can’t see the bottom of the storm very well. Anything below the cloud tops is invisible in the data,” explained Wong. “But it’s an interesting piece of data that can help us understand what’s fueling the Great Red Spot and how it’s maintaining energy.” There’s still a lot of work to do to fully understand it.
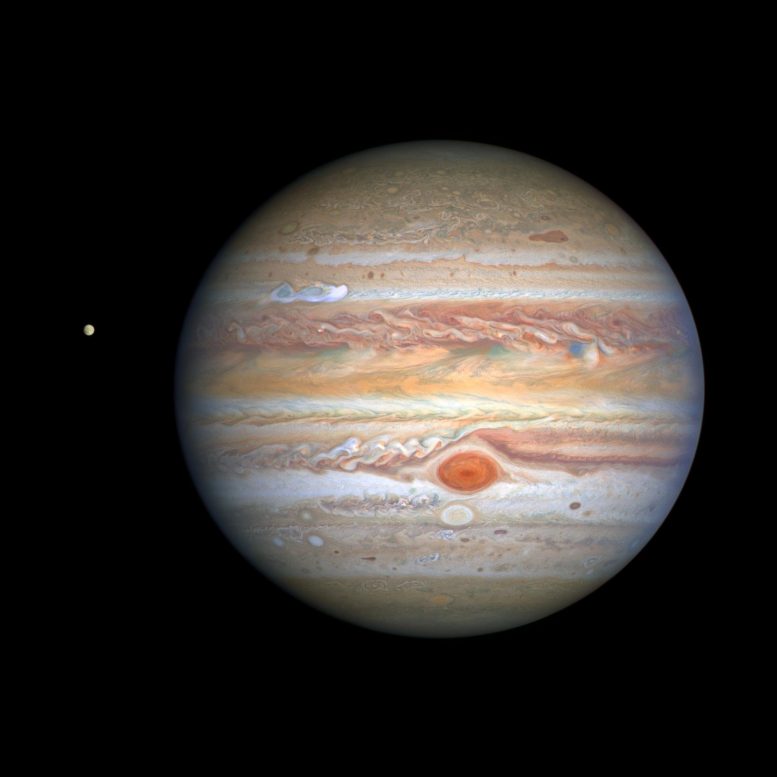
This three-dimensional model of Jupiter was computer-generated from a new global map of the planet that was taken by the NASA/ESA Hubble Space Telescope’s Wide Field Camera 3 on June 27, 2019, when the planet was 644 million kilometers from Earth. Credit: NASA, ESA, A. Simon (Goddard Space Flight Center), and M.H. Wong (University of California, Berkeley), M. Kornmesser
Astronomers have pursued ongoing studies of the “king” of solar system storms since the 1870s. The Great Red Spot is an upwelling of material from Jupiter’s interior. If seen from the side, the storm would have a tiered wedding cake structure with high clouds at the center cascading down to its outer layers. Astronomers have noted that it is shrinking in size and becoming more circular than oval in observations spanning more than a century. The current diameter is 10,000 miles across, meaning that Earth could still fit inside it.
In addition to observing this legendary, long-lived storm, researchers have observed storms on other planets, including Neptune, where they tend to travel across the planet’s surface and disappear over only a few years. Research like this helps scientists not only learn about the individual planets, but also draw conclusions about the underlying physics that drive and maintain planets’ storms.
Reference: “Evolution of the Horizontal Winds in Jupiter’s Great Red Spot From One Jovian Year of HST/WFC3 Maps” by Michael H. Wong, Philip S. Marcus, Amy A. Simon, Imke de Pater, Joshua W. Tollefson and Xylar Asay-Davis, 29 August 2021, Geophysical Research Letters.
DOI: 10.1029/2021GL093982
The majority of the data to support this research came from Hubble’s Outer Planets Atmospheres Legacy (OPAL) program, which provides annual Hubble global views of the outer planets that allow astronomers to look for changes in the planets’ storms, winds, and clouds.

