Lead Image: The James Webb Space Telescope is revolutionizing our understanding of galaxy evolution in the early universe through redshift analysis and advanced imaging techniques, leading to significant discoveries and emphasizing the need for precise spectroscopic data. Credit: SciTechDaily.com
Using redshift and photometry, NASA’s James Webb Space Telescope is uncovering the secrets of early galaxies, demonstrating the need for precise spectral data in understanding the universe’s history.
One of NASA’s James Webb Space Telescope’s science goals is to understand how galaxies in the early universe formed and evolved into much larger galaxies like our own Milky Way. This goal requires that we identify samples of galaxies at different moments in the universe’s history to explore how their properties evolve with time.
We asked Micaela Bagley, a postdoctoral fellow at the University of Texas at Austin, to explain how astronomers analyze light from distant galaxies and determine “when in the universe’s history” we are observing them.
“Light takes time to travel through space. When light from a distant galaxy (or any object in space) reaches us, we are seeing that galaxy as it appeared in the past. To determine the ‘when’ in the past, we use the galaxy’s redshift.
“Redshift tells us how long the light has spent being stretched to longer wavelengths by the expansion of the universe as it travels to reach us. We can calculate the redshift using features in the galaxy’s spectrum, which is an observation that spreads out the light from a target by wavelength, essentially sampling the light at very small intervals. We can measure the emission lines and spectral breaks (abrupt changes in the light intensity at specific wavelengths), and compare their observed wavelengths with their known emitted wavelengths.
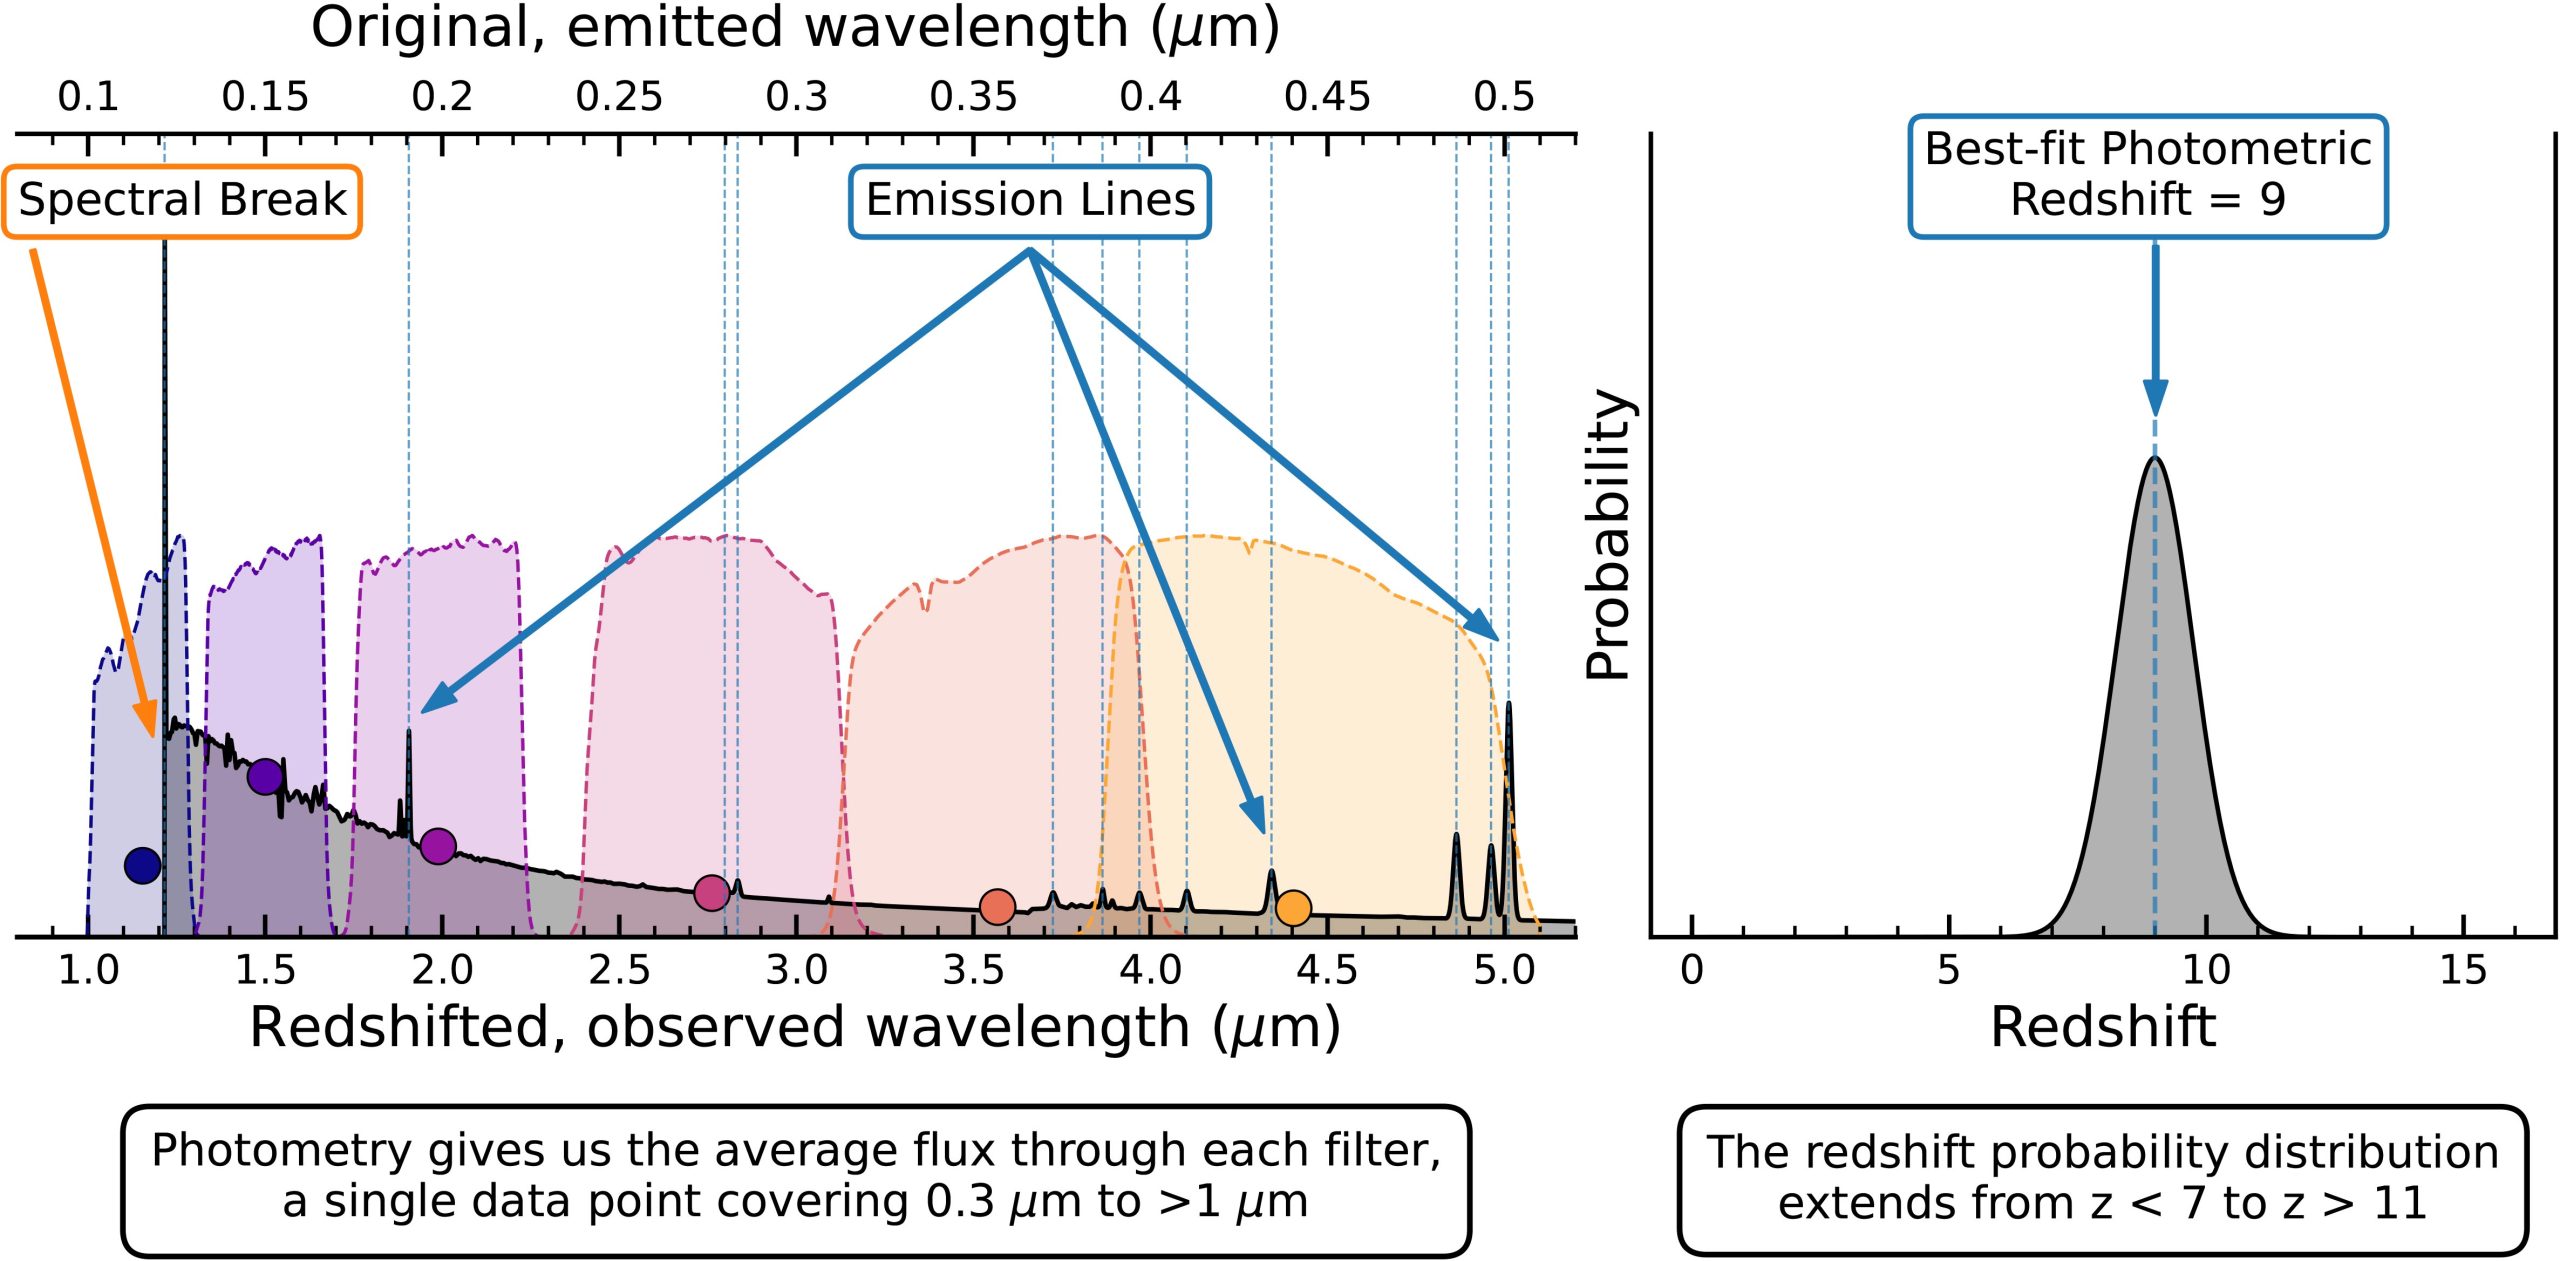
“One of the most efficient ways to identify galaxies is through imaging, for example with the observatory’s NIRCam (Near-Infrared Camera) instrument. We take images using multiple filters to collect the object’s light in several different colors. When we measure a galaxy’s photometry, or how bright it is in an image, we’re measuring the brightness of the object averaged across the full range of wavelengths transmitted by the filter. We can observe a galaxy with NIRCam’s broadband imaging filters, but there is a lot of detailed information hidden within each single measurement for every 0.3–1.0 microns in wavelength coverage.
“Yet we can start to constrain the shape of a galaxy’s spectrum. The spectrum’s shape is affected by several properties including how many stars are forming in the galaxy, how much dust is present within it, and how much the galaxy’s light has been redshifted. We compare the measured brightness of the galaxy in each filter to the predicted brightness for a set of galaxy models spanning a range of those properties at a range of redshifts. Based on how well the models fit the data, we can determine the probability that the galaxy is at a given redshift or ‘ moment in history.’ The best-fitting redshift determined through this analysis is called the photometric redshift.
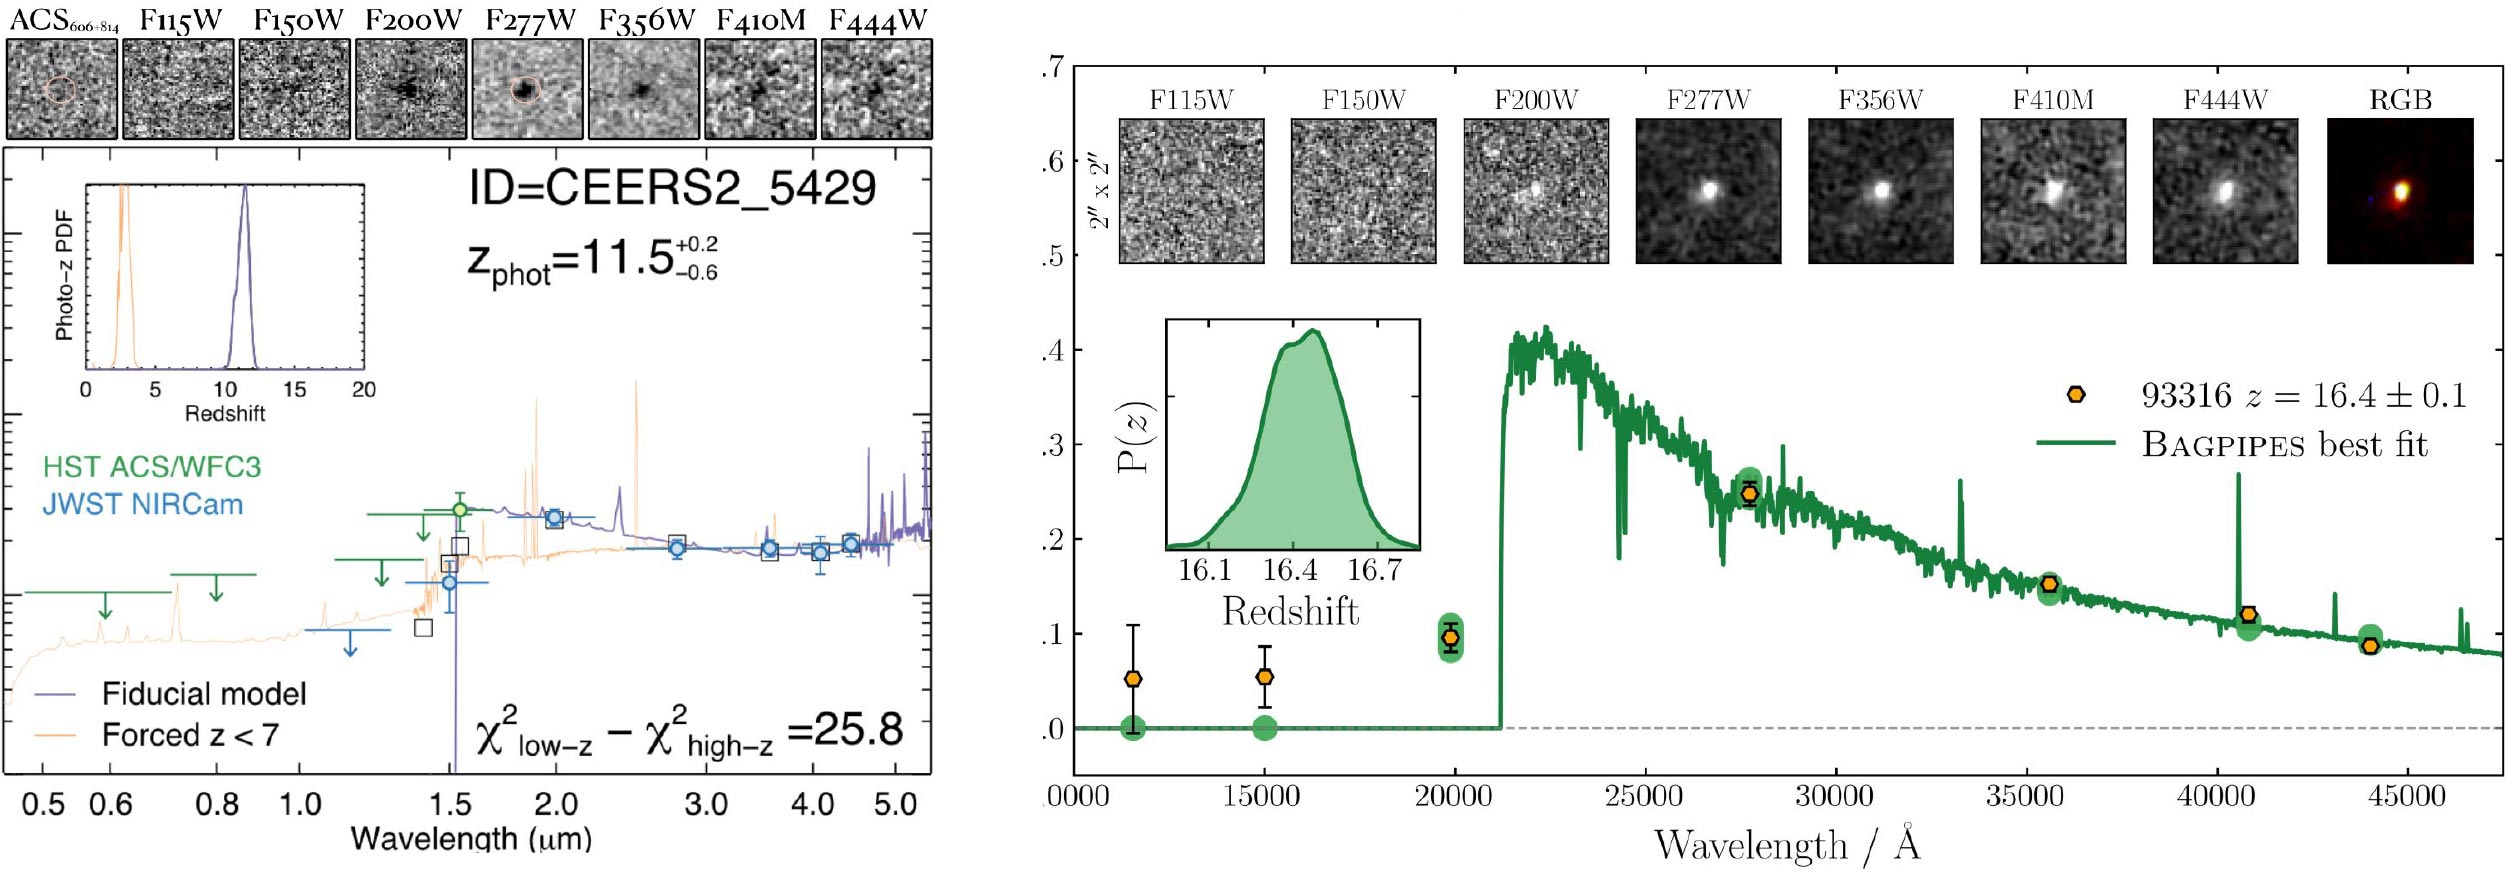
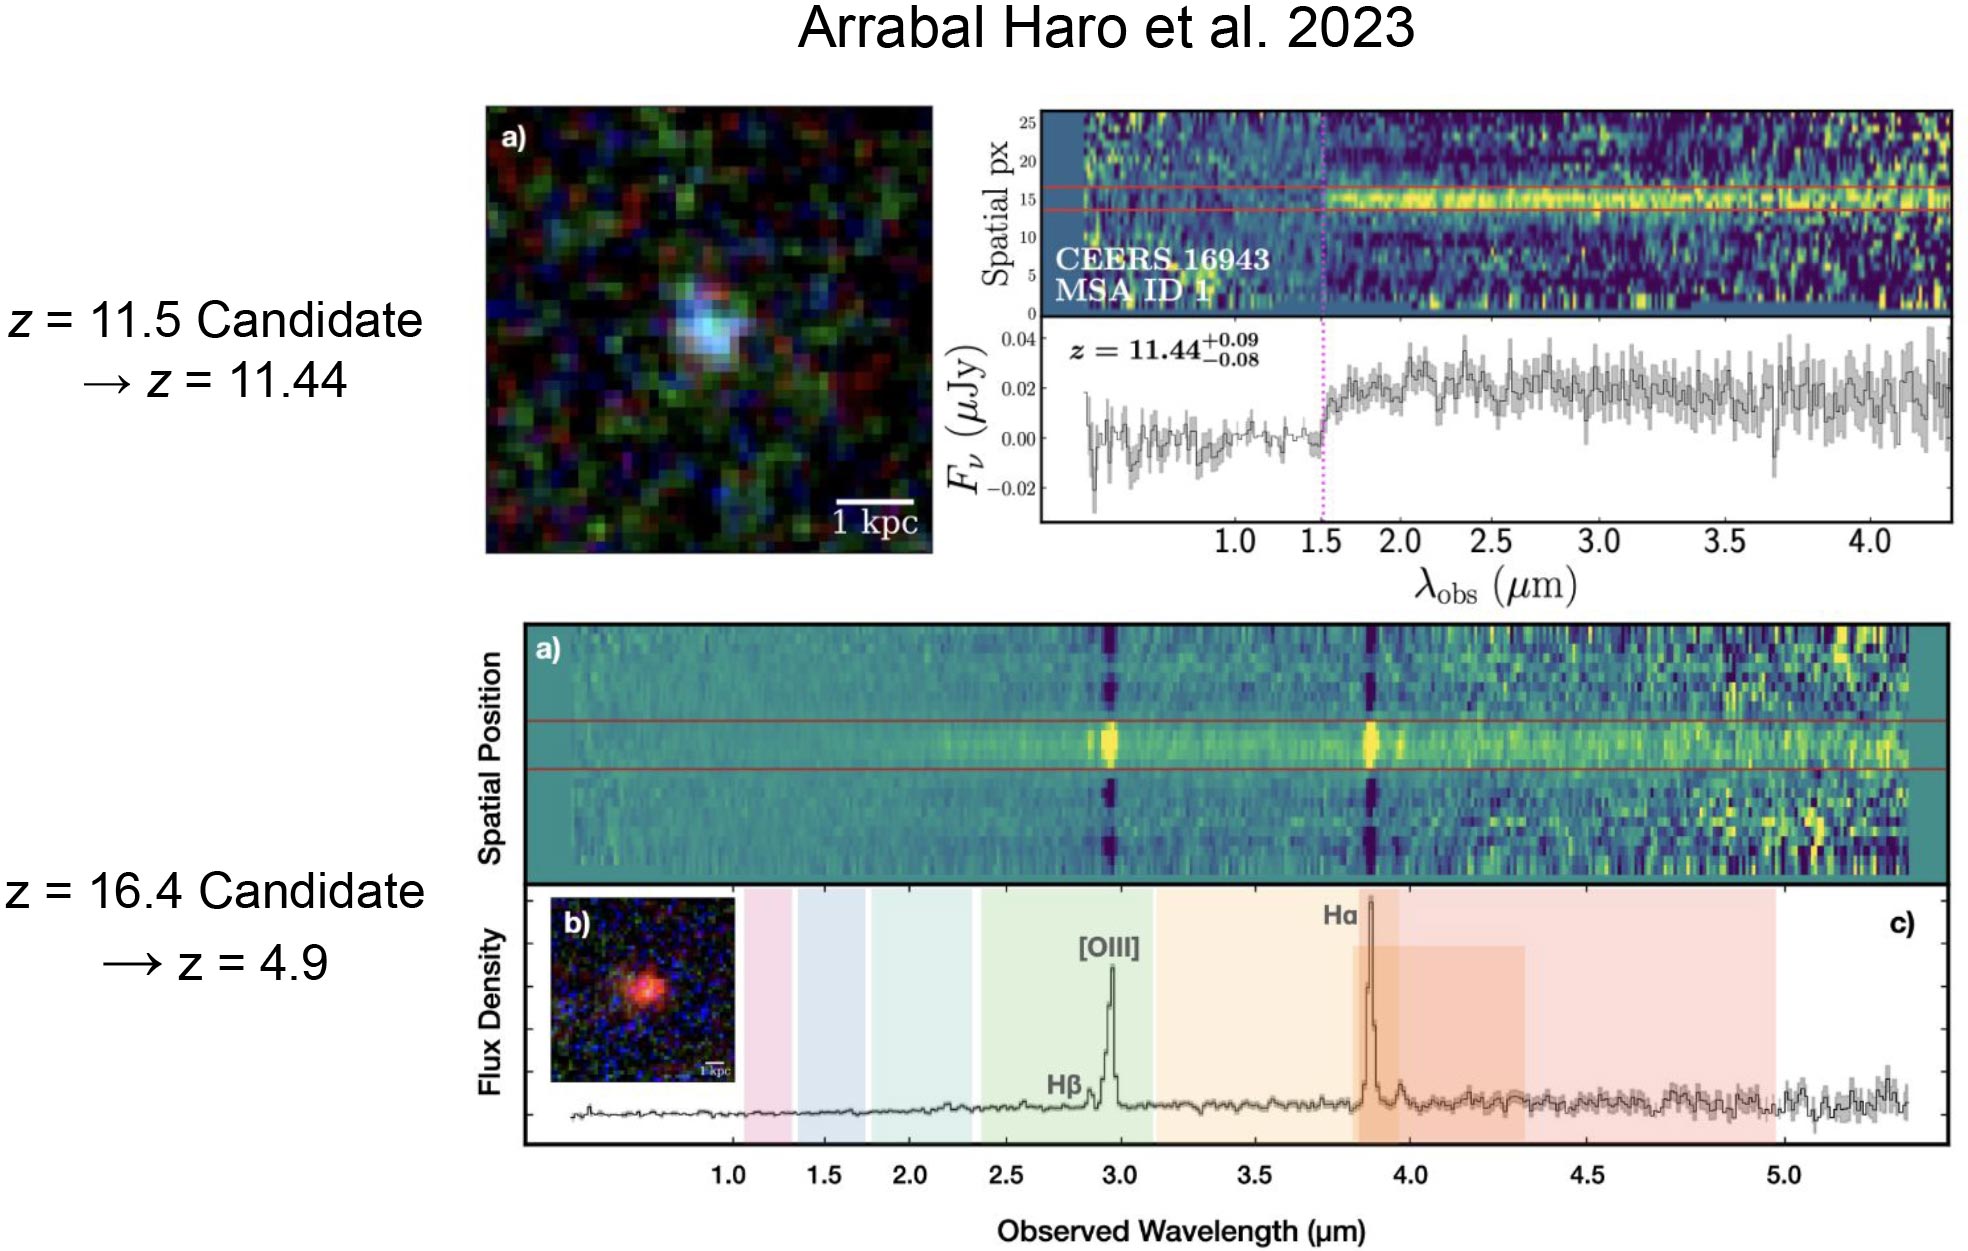
“In July 2022, teams used NIRCam images from the CEERS Survey to identify two galaxies with photometric redshifts greater than 11 (when the universe was less than 420 million years old.) Neither of these objects were detected by NASA’s Hubble Space Telescope observations in this field because they are either too faint or are detectable only at wavelengths outside of Hubble’s sensitivity. These were very exciting discoveries with the new telescope!
“However, photometric redshift of a galaxy is somewhat uncertain. For example, we may be able to determine that a spectral break is present in a filter, but not the precise wavelength of the break. While we can estimate a best-fit redshift based on modeling the photometry, the resulting probability distribution is often broad. Additionally, galaxies at different redshifts can have similar colors in broadband filters, making it difficult to distinguish their redshifts based only on photometry. For example, red, dusty galaxies at redshifts less than 5 (or when the universe was 1.1 billion years old or older) and cool stars in our own galaxy can sometimes mimic the same colors of a high-redshift galaxy. We therefore consider all galaxies that are selected based on their photometric redshifts to be high-redshift candidates until we can obtain a more precise redshift.
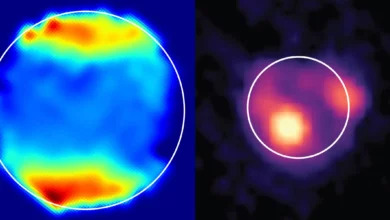
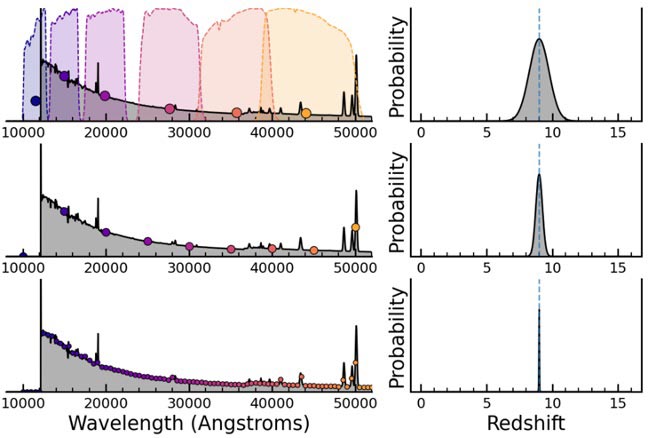
“We can determine a more precise redshift for a galaxy by obtaining a spectrum. As illustrated in the following figure, our calculation of the redshift probability distribution improves as we measure the photometry of a galaxy in ever finer wavelength steps. The probability distribution narrows as we move from using broadband filters for imaging (top) to a larger number of narrower filters (middle), to a spectrum (bottom). In the bottom row we can start to key off specific features like the spectral break on the far left and emission lines to obtain a redshift probability distribution that is very precise – a spectroscopic redshift.
“In February 2023, the CEERS teams followed up their high-redshift candidates with observatory’s NIRSpec (Near-Infrared Spectrograph) instrument to measure precise, spectroscopic redshifts. One candidate (Maisie’s Galaxy) has been confirmed to be at redshift 11.4 (when the universe was 390 million years old), while the second candidate was discovered to actually be at a lower redshift of 4.9 (when the universe was 1.2 billion years old.)
About the Author:
Micaela Bagley is a postdoctoral fellow at the University of Texas at Austin and a member of CEERS. They study galaxy formation and evolution in the early universe. Micaela is also responsible for processing all the NIRCam images for the CEERS team.