Over the next 10 years, programmers and climate scientists will work together on the wildly detailed Earth twin. The scientists hope the resulting model will help everyone run simulations to make better, more reasoned plans for approaching extreme climate events and new challenges.
This project is a collaboration between the European Centre for Medium-Range Weather Forecasts (ECMWF), the European Space Agency (ESA), and the European Organisation for the Exploitation of Meteorological Satellites (EUMETSAT). The actual programming and computing is happening at ETH Zurich and the Swiss national Supercomputing Centre (CSCS).
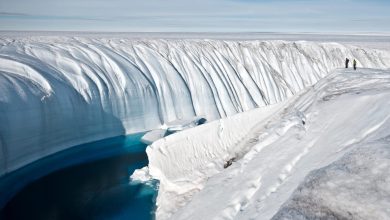
To become climate neutral by 2050, the European Union launched two ambitious programs: “Green Deal” and “DigitalStrategy”. As a key component of their successful implementation, climate scientists and computer scientists launched the “Destination Earth” initiative, which will start in mid-2021 and is expected to run for up to ten years. During this period, a highly accurate digital model of the Earth is to be created, a digital twin of the Earth, to map climate development and extreme events as accurately as possible in space and time.
Observational data will be continuously incorporated into the digital twin in order to make the digital Earth model more accurate for monitoring the evolution and predict possible future trajectories. But in addition to the observation data conventionally used for weather and climate simulations, the researchers also want to integrate new data on relevant human activities into the model. The new “Earth system model” will represent virtually all processes on the Earth’s surface as realistically as possible, including the influence of humans on water, food and energy management, and the processes in the physical Earth system.

Information system for decision-making
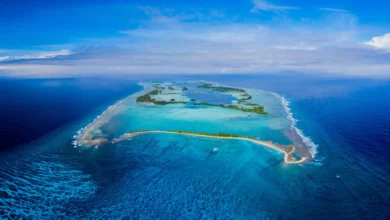
The digital twin of the Earth is intended to be an information system that develops and tests scenarios that show more sustainable development and thus better inform policies. “If you are planning a two-meter high dike in The Netherlands, for example, I can run through the data in my digital twin and check whether the dike will in all likelihood still protect against expected extreme events in 2050,” says Peter Bauer, deputy director for Research at the ECMWF and co-initiator of Destination Earth. The digital twin will also be used for strategic planning of fresh water and food supplies or wind farms and solar plants.
Together with other scientists, Bauer is driving the climate science and meteorological aspects of the Earth’s digital twin, but they also rely on the know-how of computer scientists from ETH Zurich and the Swiss National Supercomputing Centre (CSCS), namely ETH professors Torsten Hoefler, from the Institute for High Performance Computing Systems, and Thomas Schulthess, Director of CSCS.
Using data about climate as well as human activities, the souped-up and superpowered version of something like Google Earth will help experts trace through the consequences of weather events as well as human structures—like whether a program to buoy sinking parts of Venice will withstand more rapidly rising waters, for example, or whether a levee will hold during a severe storm.
“The new Earth system model will represent virtually all processes on the Earth’s surface as realistically as possible, including the influence of humans on water, food and energy management, and the processes in the physical Earth system,” ETH Zurich says in a statement. This is in addition to extensive climate data, creating one unified model that also brings together computer science and climate studies.
Like the Pentagon’s rising use of digital engineering in military craft, the “Earth twin” has a goal of saving money on costly design errors for projects that are unlikely to succeed. And with climate change, there’s a secondary reason to use a digital twin: we’re running out of time. A process or climate mitigation strategy that can be tested and tuned on the digital Earth twin can save crucial time and energy in the fight against worsening climate events.
Climate computer models have stagnated because of the way they were developed and maintained, ETH Zurich explains. For years, improving these models has been a matter of simply adding more powerful computer processors. Very detailed models could depict more and more data by crunching that data at a higher speed, and for a long time, this seemed like a never-ending option for improvement.
But now, much more sophisticated models involving complex algorithms can be leveraged with the massive amount of data that computers today can crunch. This is why the Earth twin will take a full decade to code and put into action. The coders and designers will be making hardware changes while building out the algorithms they need, with a goal to use both sides to their best effect.
There’s one last snag in the process: Just where do you put a computer system that will require an estimated 20,000 CPUs? And where are you supposed to put that system if it’s carbon-neutral itself? This could be a remote location in a colder region, where natural cooling and renewable natural energy could both be large benefits. We’ll find out soon.
Weather and climate models as a basis
In their paper, the researchers look back on the steady development of weather models since the 1940s, a success story that took place quietly. Meteorologists pioneered, so to speak, simulations of physical processes on the world’s largest computers. As a physicist and computer scientist, CSCS’s Schulthess is therefore convinced that today’s weather and climate models are ideally suited to identify completely new ways for many more scientific disciplines how to use supercomputers efficiently.
In the past, weather and climate modeling used different approaches to simulate the Earth system. Whereas climate models represent a very broad set of physical processes, they typically neglect small-scale processes, which, however, are essential for the more precise weather forecasts that in turn, focus on a smaller number of processes. The digital twin will bring both areas together and enable high-resolution simulations that depict the complex processes of the entire Earth system. But in order to achieve this, the codes of the simulation programs must be adapted to new technologies promising much enhanced computing power.
With the computers and algorithms available today, the highly complex simulations can hardly be carried out at the planned extremely high resolution of one kilometer because for decades, code development stagnated from a computer science perspective. Climate research benefited from being able to gain higher performance by ways of new generations of processors without having to fundamentally change their program. This free performance gain with each new processor generation stopped about 10 years ago. As a result, today’s programs can often only utilize 5 per cent of the peak performance of conventional processors (CPU).
For achieving the necessary improvements, the authors emphasize the need of co-design, i.e. developing hardware and algorithms together and simultaneously, as CSCS successfully demonstrated during the last ten years. They suggest to pay particular attention to generic data structures, optimized spatial discretization of the grid to be calculated and optimization of the time step lengths. The scientists further propose to separate the codes for solving the scientific problem from the codes that optimally perform the computation on the respective system architecture. This more flexible program structure would allow a faster and more efficient switch to future architectures.
Profiting from artificial intelligence
The authors also see great potential in artificial intelligence (AI). It can be used, for example, for data assimilation or the processing of observation data, the representation of uncertain physical processes in the models and data compression. AI thus makes it possible to speed up the simulations and filter out the most important information from large amounts of data. Additionally, the researchers assume that the use of machine learning not only makes the calculations more efficient, but also can help describing the physical processes more accurately.
The scientists see their strategy paper as a starting point on the path to a digital twin of the Earth. Among the computer architectures available today and those expected in the near future, supercomputers based on graphics processing units (GPU) appear to be the most promising option. The researchers estimate that operating a digital twin at full scale would require a system with about 20,000 GPUs, consuming an estimated 20MW of power. For both economic and ecological reasons, such a computer should be operated at a location where CO2-neutral generated electricity is available in sufficient quantities.