As the market is pacing up, things are becoming messier and stressful to handle. Optimization of a website’s performance to create result-driven possibilities takes the marketer’s into a swirl of confusions. You need to keep your eyes on the visitor counts while checking along on your website’s daily stats.
The battle to outshine your competitors makes you surpass multiple avenues— the rapidly changing trends, innovative tools to analyze, and revenue generation—that contribute to the ultimate success. However, thanks to the advancement in technology, new tools and software surface the industry to stabilize the business foundation. One such tool is- The Google Analytics.
If you are planning to use the tool to make your website prosper efficiently, here are some Google reports you must go try evaluating.
Report #1- Benchmarking
Benchmarking report gives you a detailed overview of how your competitors are performing. It tells about the rate of conversions and pageview per channel and average session duration. If you want to get to the report, simply click on the “Audience” link in the tool and then to “Benchmarking” then click “Channels” for Logo Designer UK.
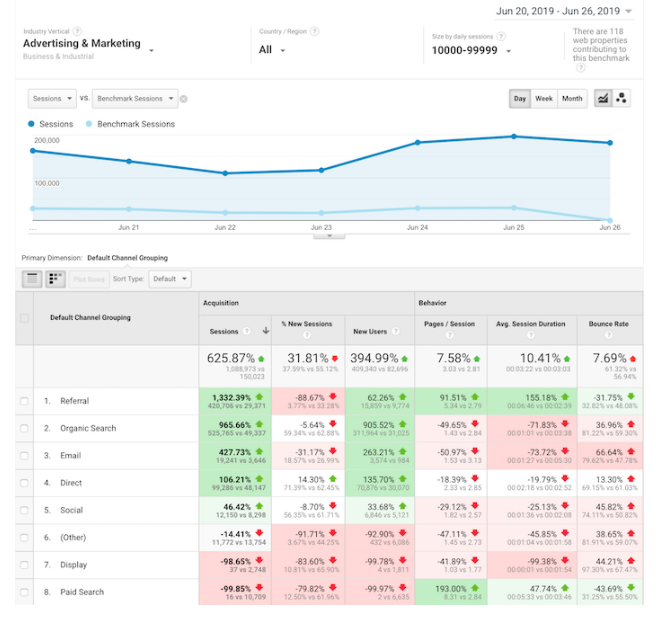
The stated procedure will open the above-shown view of the tool. The stats will show you how to stay ahead of the curve and what areas you need to improvise for better progress. It’s useful to have a clear picture as to how good or bad your competitor is performing. It lets you improvise your strategy.
Report #2- Cohort Analysis
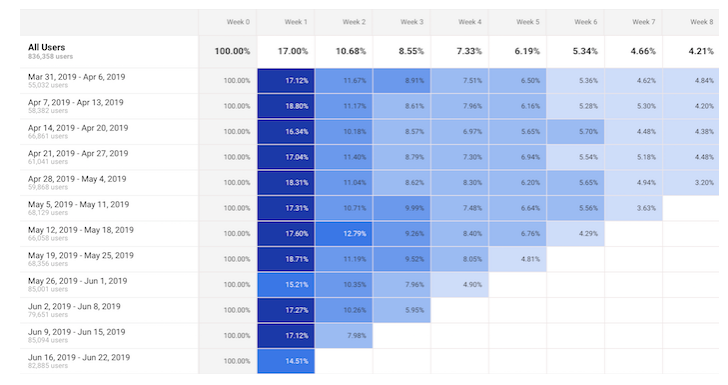
You know vital it is to keep a check on your visitors. With the help of Cohort Report, you can find out the number of returning visitors. Instead of attracting new visitors, try to bring back the older ones. It strengthens the credibility and efficiency of the website.
The procedure to view the Cohort report is from the “Audience” section. You have to go to the tab and further click on the “Cohort Analysis”.
You can select a specific date range, let say “12 weeks” in the drop-down menu of the tool. The following table will appear that will indicate several aspects. Towards the left end, there will be the percentage mentioned whereas on the top will be the columns that begin with the labels Week 1, Week 2 and so on. Every week the stats will get updated and you can get a clear picture as to the number of returning visitors.
Are you still wondering what good these stats can bring to our website? Take a look at the picture below:
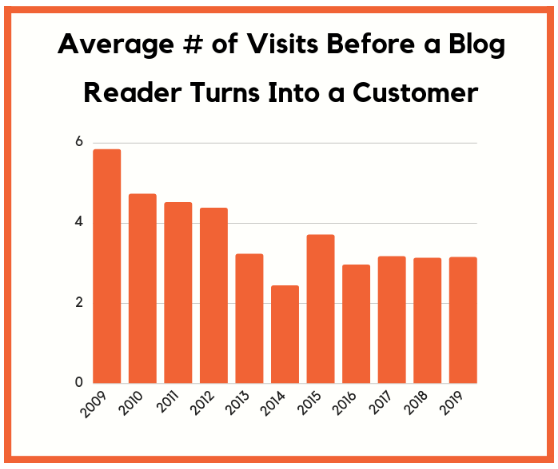
As you can see from the image that an average site visitor will have to return at least 1.3x times before converting into a prospective lead.
Report #3- Source Medium Report
Do you wonder where your users come from? That’s what this report services well. Source Medium provides the rawest data and shows how many regions are present or have visited your website and from where they belong. The moment a visitor enters your platform and starts a session, he got sorted out into one of the region’s column.
Not only this, the tool caters 3 most important aspects of website analysis- Accusation, Behavior and Customer. The descriptive breakdown of every customer helps in comparing the results and analyzing what could be done best to improve. You will be able to find the region that is most potential to increase the traffic.
Furthermore, you can even take a look at the traffic navigated for your paid campaigns belonging to any brand like Logo Designer in Melbourne. It’s very important to keep a check on the performance of your paid campaigns. Through the tool you can keep a detailed look at the report.
Report #4- Assisted Conversions
The Assistive Conversion report is useful when you want to peek into how different platforms are working in generating traffic for our brand. You can click to “Conversions” then “Multi-Channel Funnels” and then to the “Assistive Conversions”.
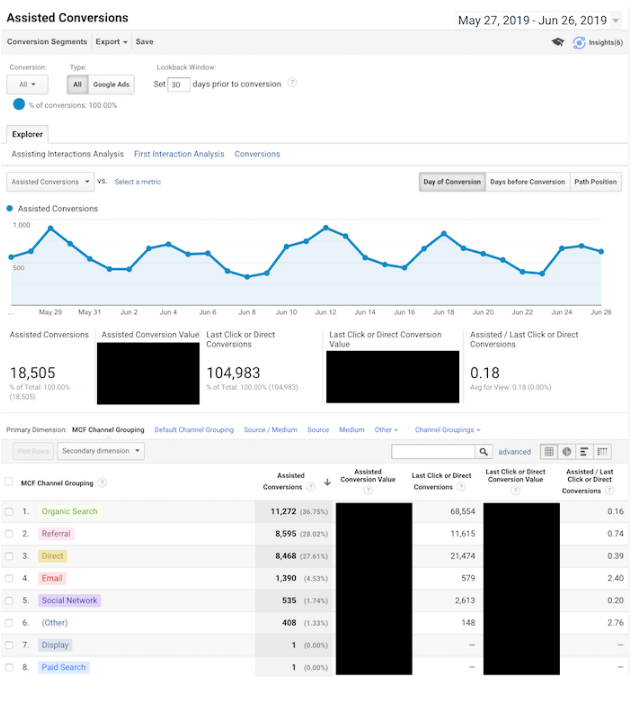
Source: Neil Patel
With the help of the report, you can learn about the multiple channels with a higher concentration of target audience.
Report #5- User Explorer
You must have learned how important it is to understand and observe the user’s behavior. It helps you maximize your business horizon and generate increased outcomes. One such way to do that is available in Google Analytics. Click on “Audience” and go to the “User Explorer” link. Once you click it you will see a list of users who navigated to our website. Upon clicking each one of them you can view the detailed history of their activities., Where they head and what they click, each activity will appear automatically.
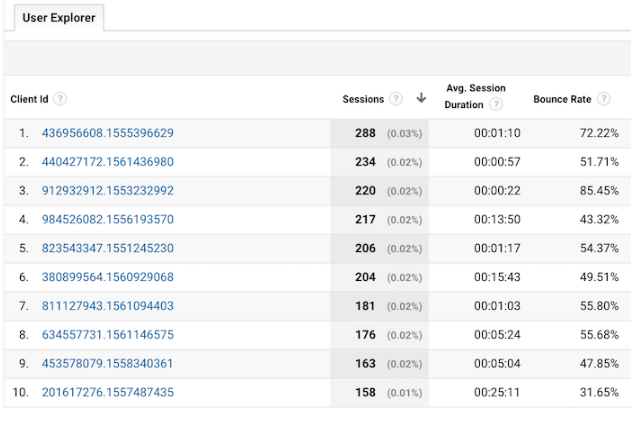
Take a look at the picture below:
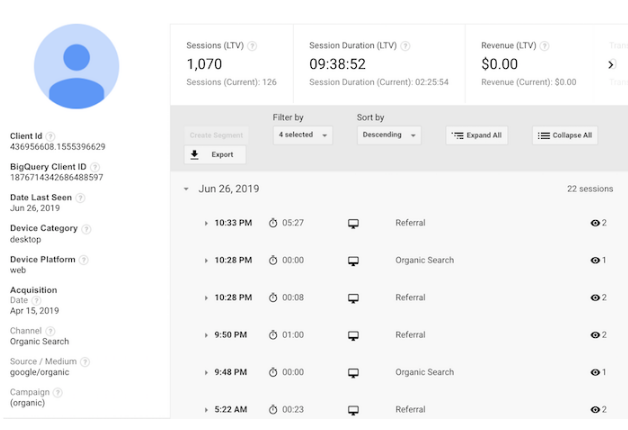
See that’s how each activity will appear with respect to the username and the time he visited.
Report #6- Mobile Performance
You know how massive smartphone usage is, almost up to 2.3 billion users. Consider such growing number its important you check how friendly and responsive your website is for the smartphone users. If you look at the image shared you will find that the stats clearly show how high the bounce rate is for the Android users. So, in this way, you need to check the performance and make the necessary improvements.
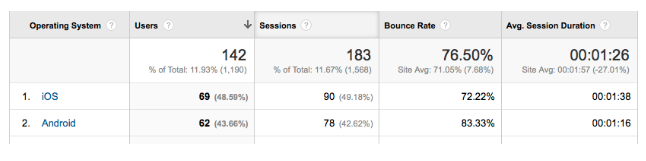
When optimizing your website stay function properly on diverse platforms, it’s important to check the ins and outs of different platforms. There are certain aspects that satisfy IOS functionality a bit differently than Android.
Report #7- Keyword Analysis
Indexing the right keywords help in optimizing the website. With the use of most searched keywords, you can increase the online visibility and performance of your site. The tool provides a comprehensive overview of the report. In the first tab, you will find the breakdown of stats in the following categories namely unique visitors, goal completions, average page load time and goal conversion rates.
As you move towards the next tab you will come across the tabs to increase the engagements. These tabs include unique pageviews, avg. time on page, avg. time on page, goal conversion rate, bounce rate, pages/visit, and percentage exit. The third terminal is of revenues. It belongs to the transactional aspect of the site. It shows the per visit value of your website. You can find out the e-commerce conversion rates and revenue generation value.
Winding Down
These 7 reports let you have a detailed analysis of your website’s performance. It covers all the aspects from revenue to traffic to conversion rates. No need to dig deep into the tool if you keep a regular check on these 7 reports. Your website will make outbound sale and will outshine the rivals in a blink of an eye. In addition, these reports will help you create a firm foundation as well.